03 / Analysis
Analytical Objectives
01
Load CSV & inspect shape
Head, Info, Describe
Handle missing values
Remove duplicates
Fix data types & over index
Add phase labels
02
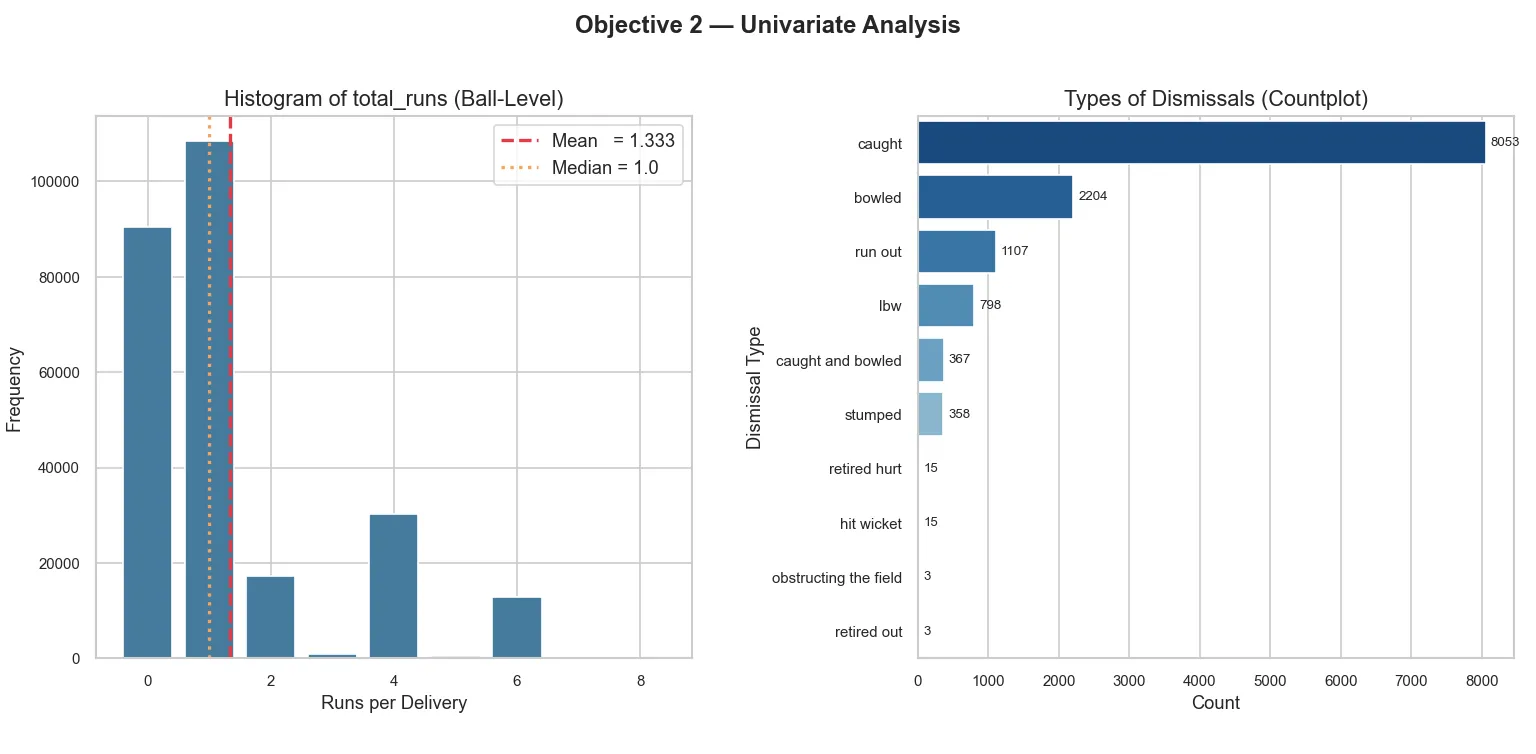
Histogram of total_runs & Dismissal Countplot
The vast majority of deliveries yield 0 or 1 run, confirming T20's dot-ball importance.
"Caught" dominates dismissals (8,053), followed by "Bowled" (2,204) — emphasising the value
of attacking field placements and tight bowling lines.
03
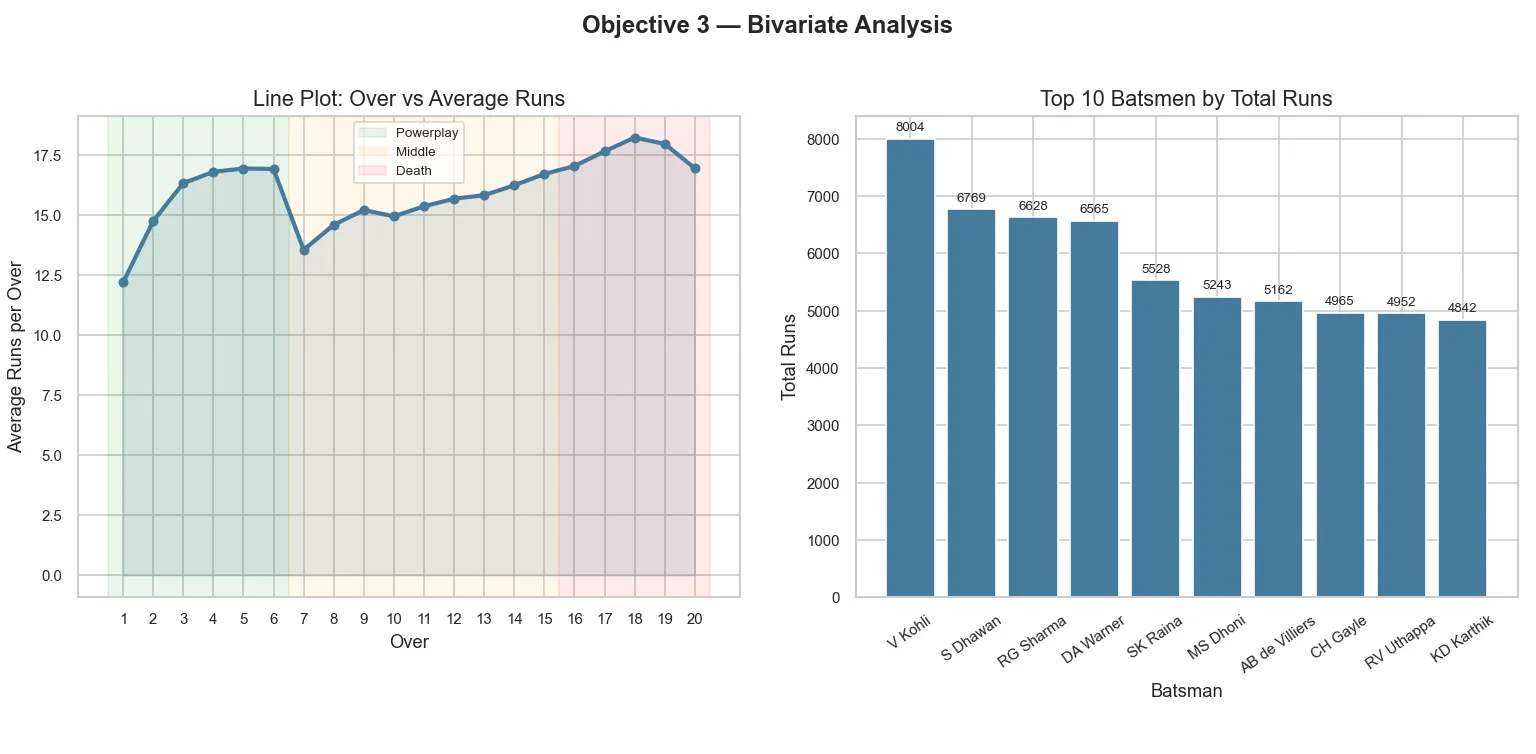
Line Plot: Over vs Average Runs & Top 10 Batsmen
Run rate dips in the early middle overs (overs 7–8) as new batsmen settle, before
climbing steadily through the death. V Kohli leads all-time runs at 8,004 — nearly 1,300
runs clear of second-placed S Dhawan.
04
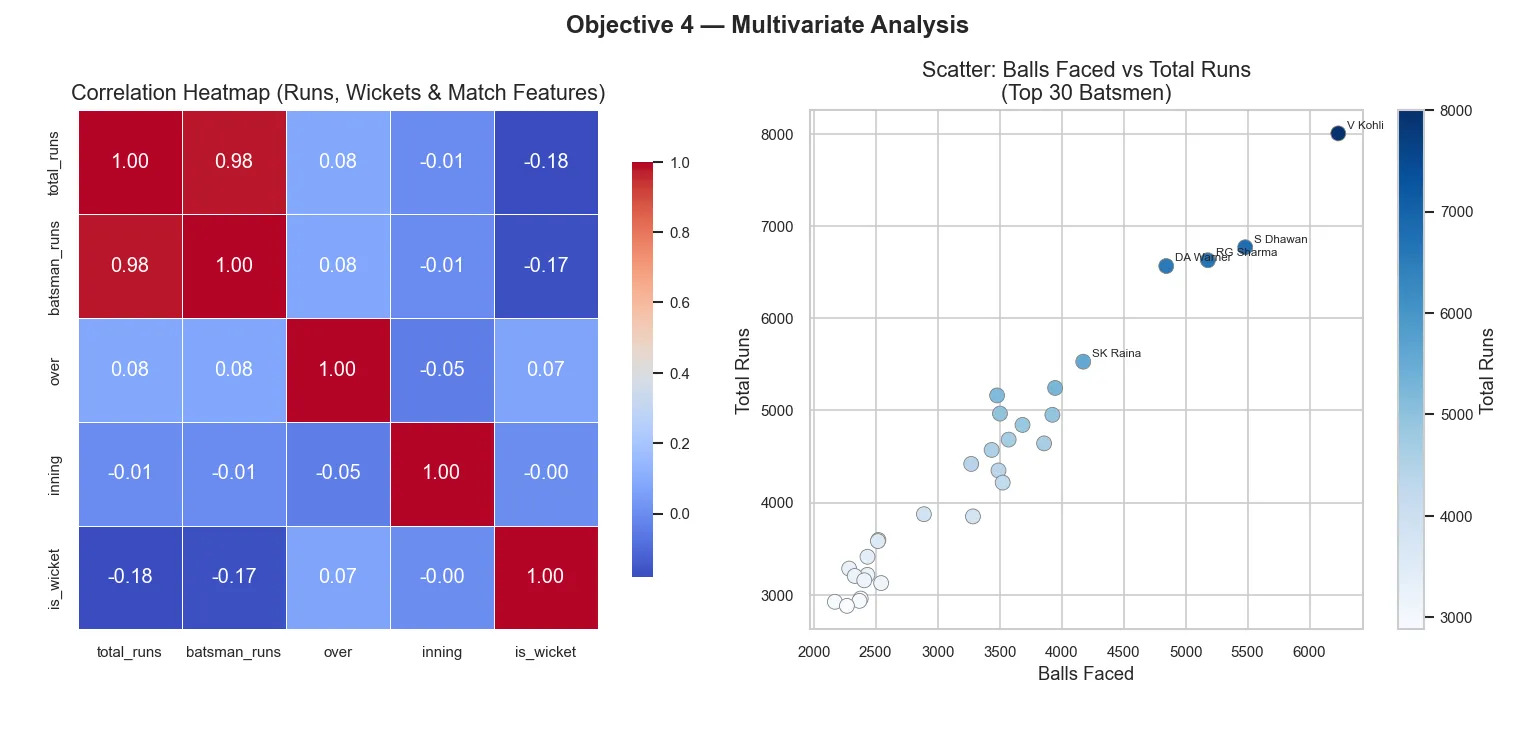
Correlation Heatmap & Balls Faced vs Total Runs Scatter
total_runs and batsman_runs show near-perfect correlation (0.98), confirming
batting dominates scoring. The scatter plot clearly separates elite volume scorers —
V Kohli sits alone in the top-right, combining maximum balls faced with maximum runs.
05
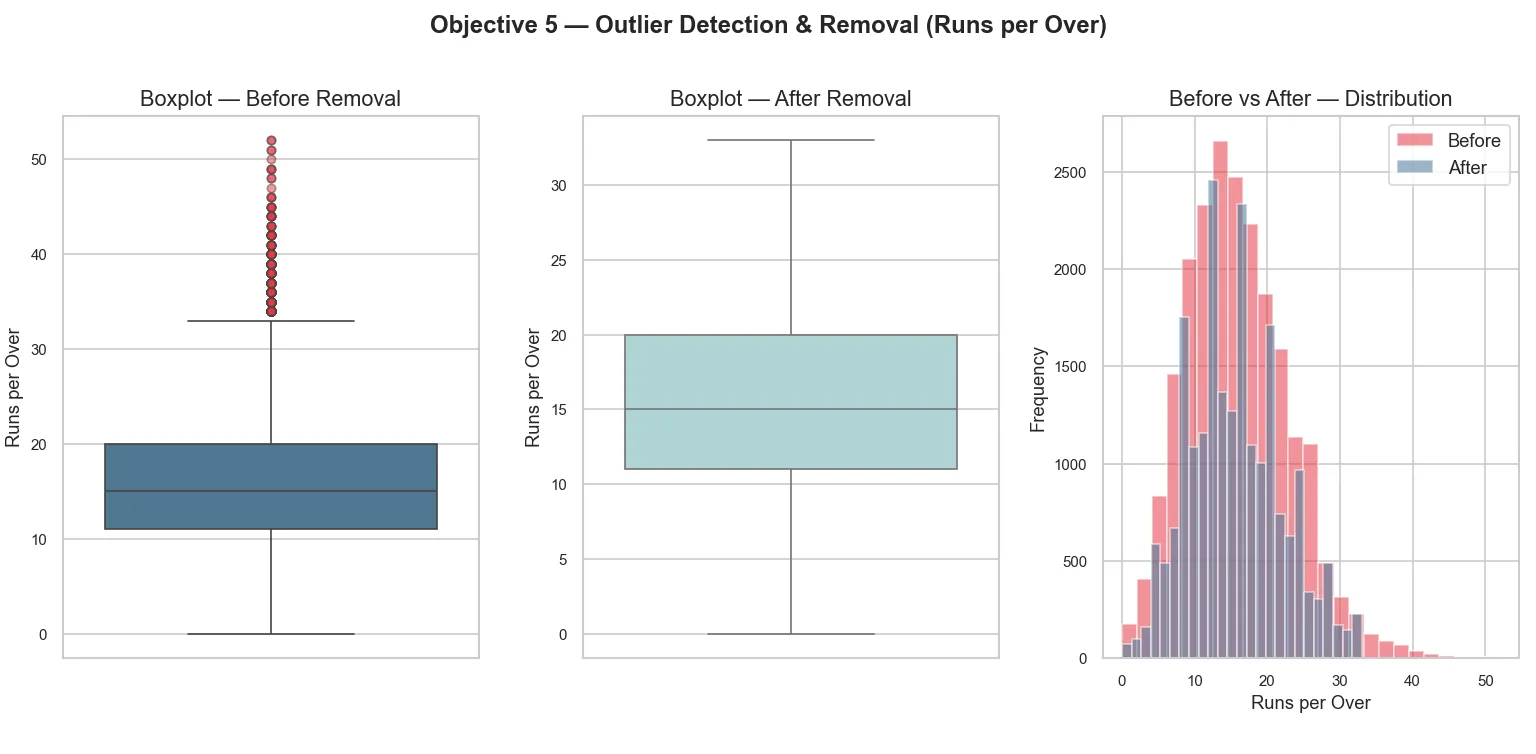
Boxplot Before/After + Distribution Comparison
369 outlier overs were removed (overs with anomalously high or low run totals —
e.g., injury interruptions or extraordinary hitting). Post-removal, the distribution is
cleaner and the regression model trains on representative data.
06
Model
Linear Regression
Coefficient
+0.1198
MSE
40.98
R² Score
0.0106
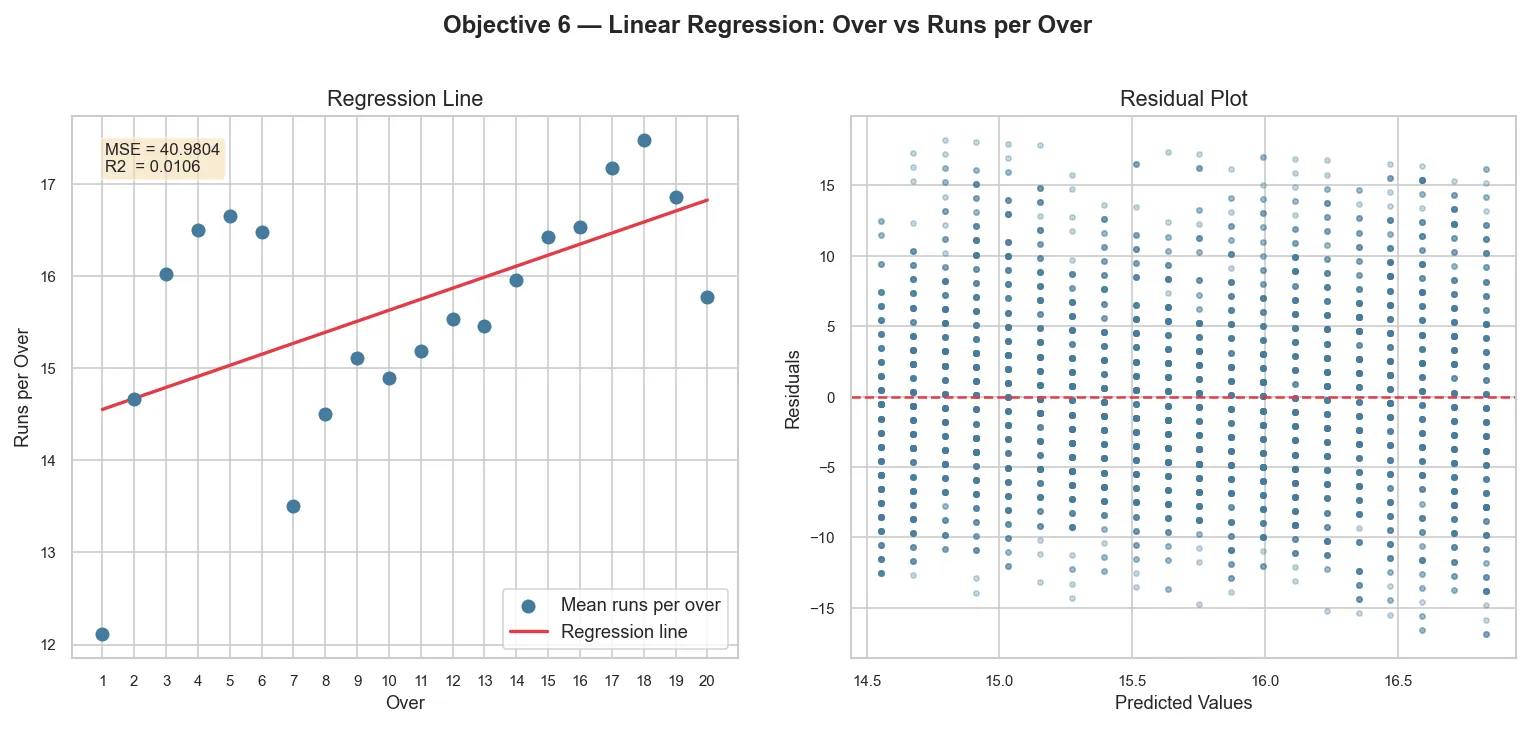
Regression Line + Residual Plot
The positive coefficient (0.12) confirms that runs per over increase as the innings
progresses. The low R² reflects that "over number" alone can't fully predict scoring —
pitch conditions, batting lineup, and match situation all add variance captured in the residuals.
07
H₀
Mean runs/over in Powerplay = Mean runs/over in Death overs
→
Verdict
REJECT H₀ · p ≈ 0.000000 · t = −10.707
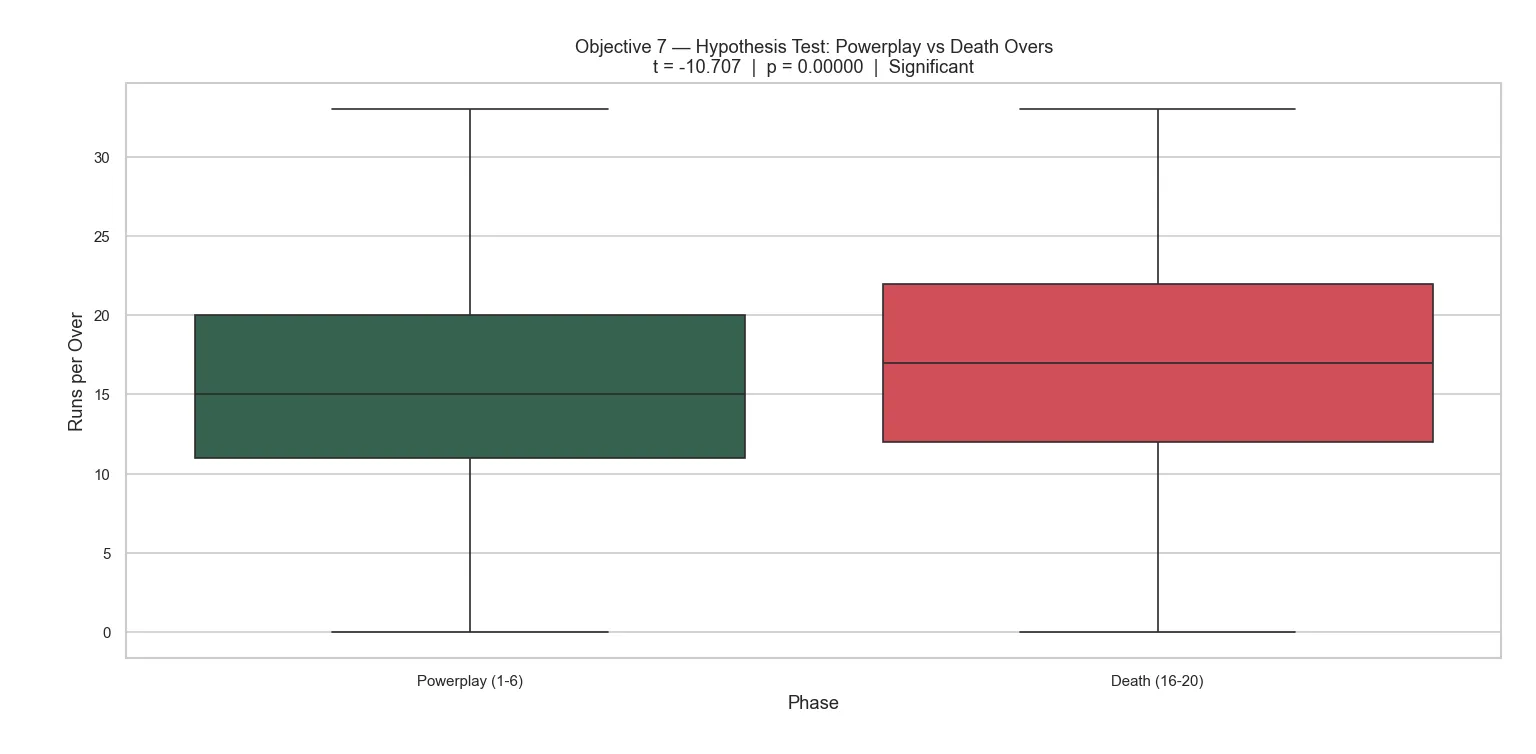
Boxplot: Powerplay vs Death Overs
Death overs show a higher median and wider spread — reflecting aggressive hitting and higher risk.
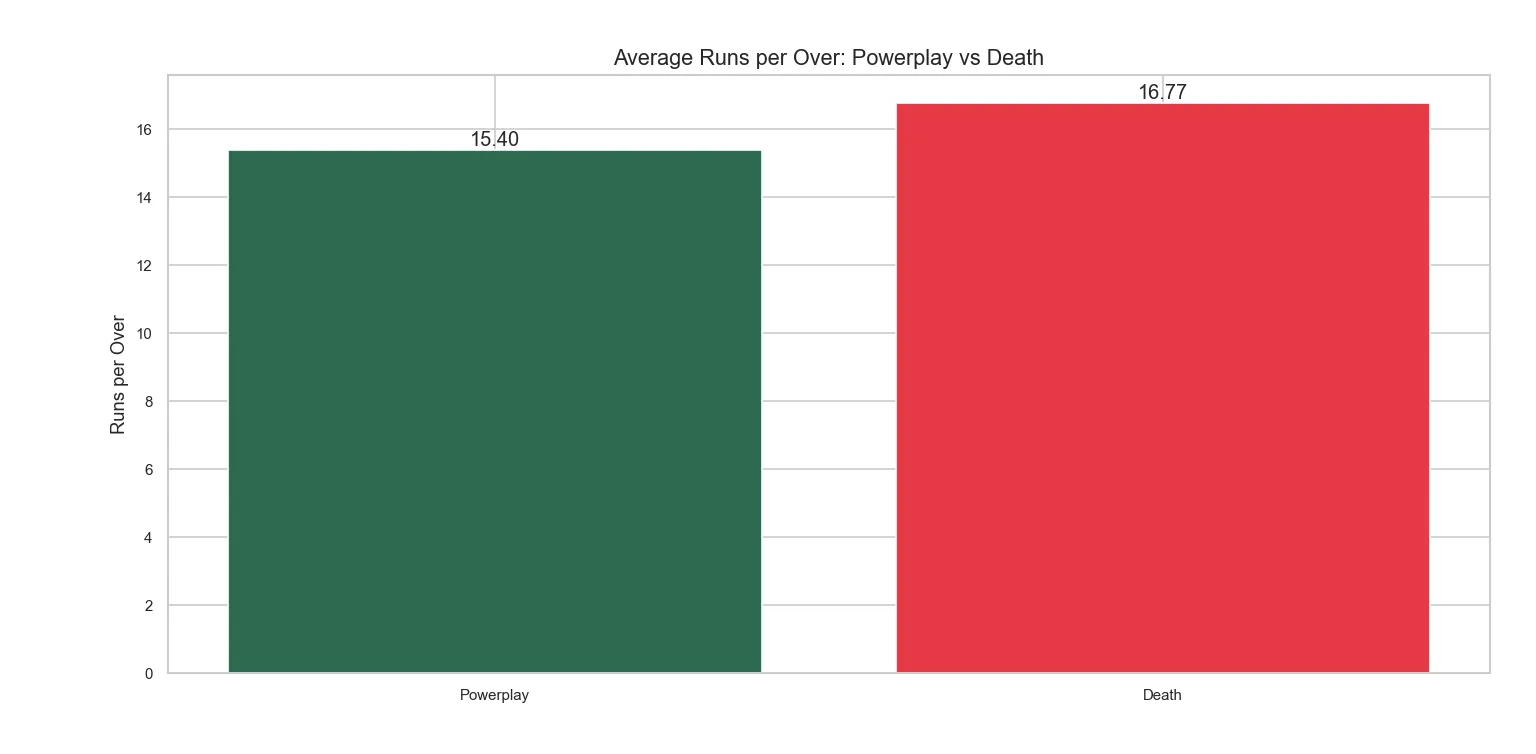
Average Runs per Over: Phase Comparison
Death (16.77) clearly outscores Powerplay (15.40) on average — confirmed as statistically significant.
08

Top Batsmen · Top Bowlers
V Kohli leads total runs (8,004), while YS Chahal dominates with 213 wickets.
These charts highlight the most consistent performers in IPL history.
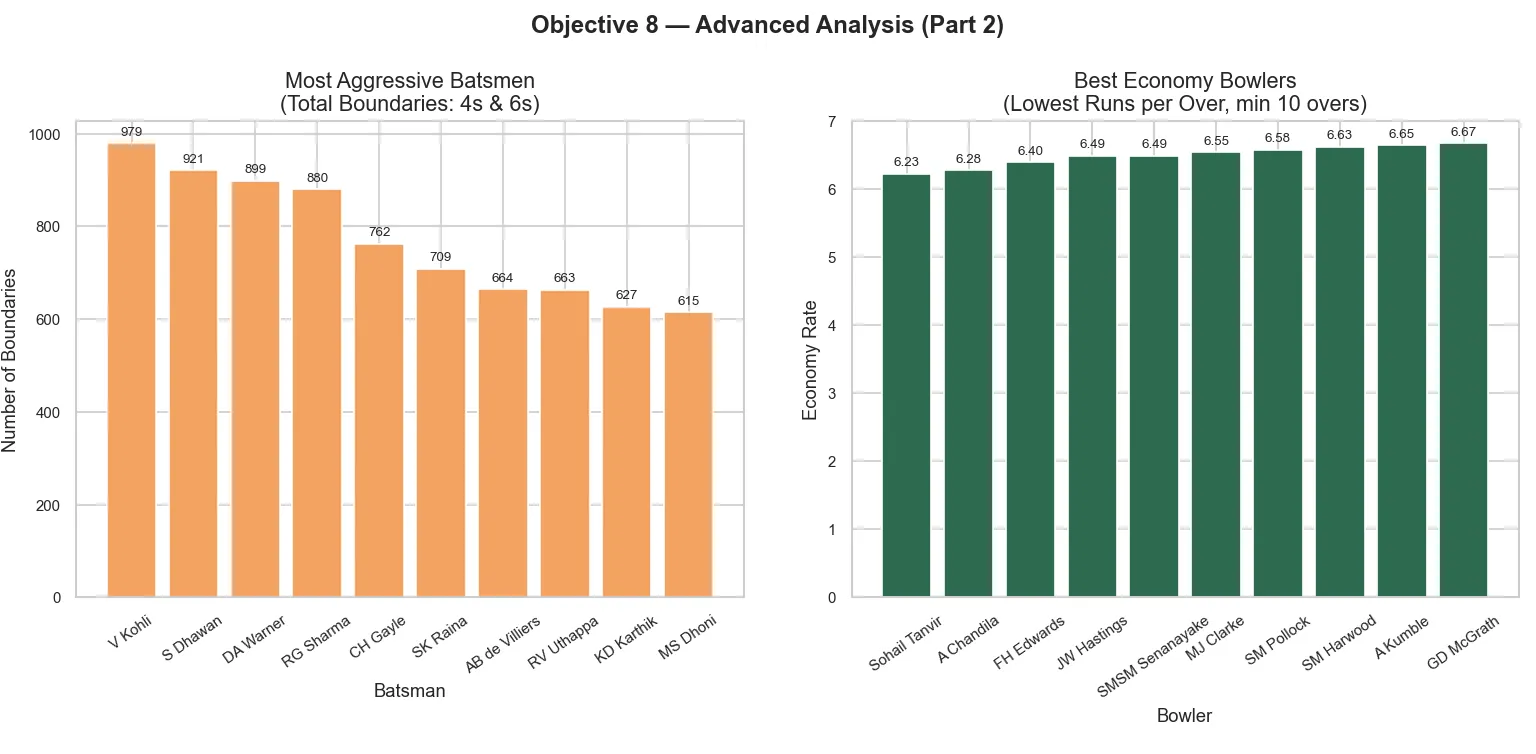
Boundaries · Economy Rates
V Kohli also tops boundary count (979). Bowlers like Sohail Tanvir (6.23)
and A Chandila (6.28) showcase exceptional economy in a high-scoring format.
+
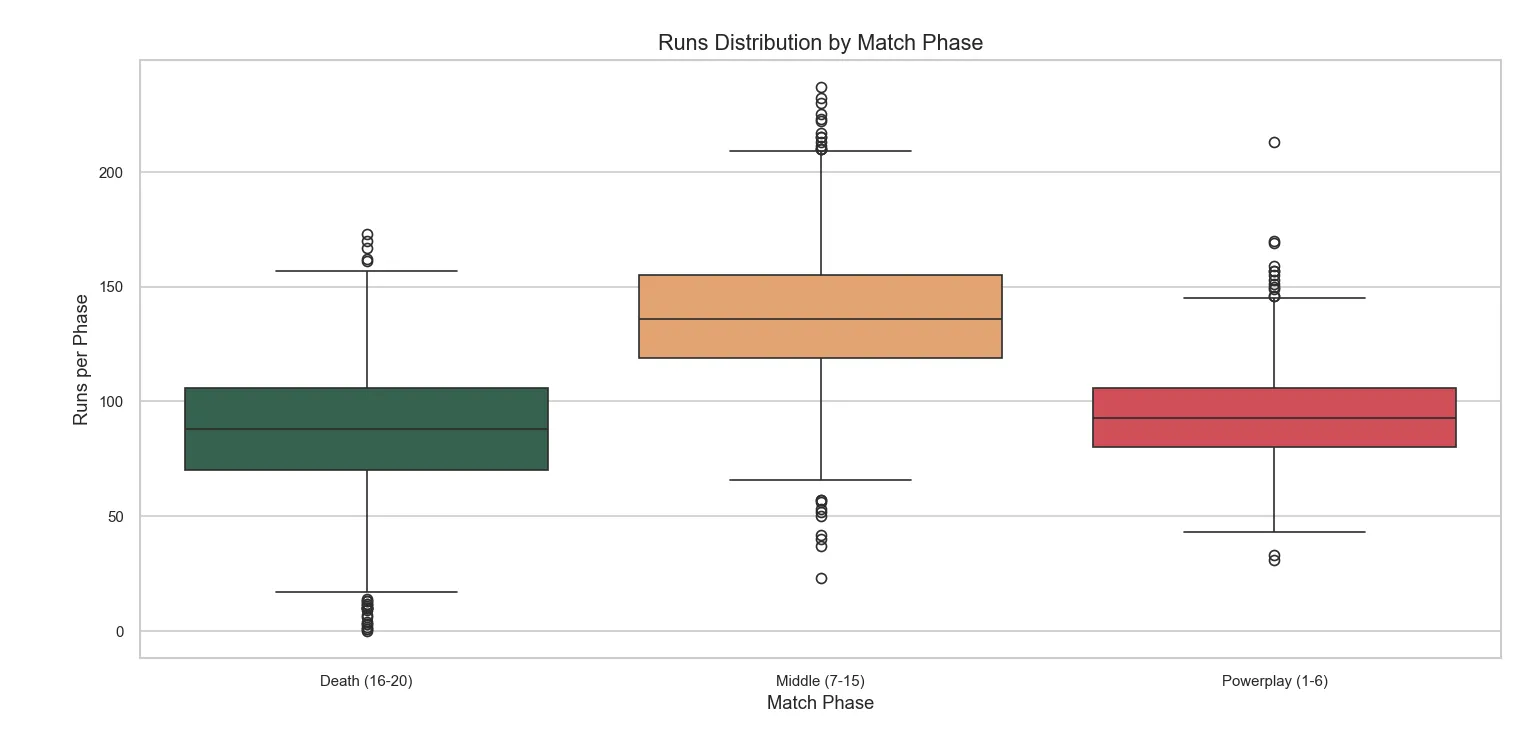
Runs Distribution by Match Phase
Middle overs produce the highest aggregate runs — expected given 9 overs vs 5 for death.
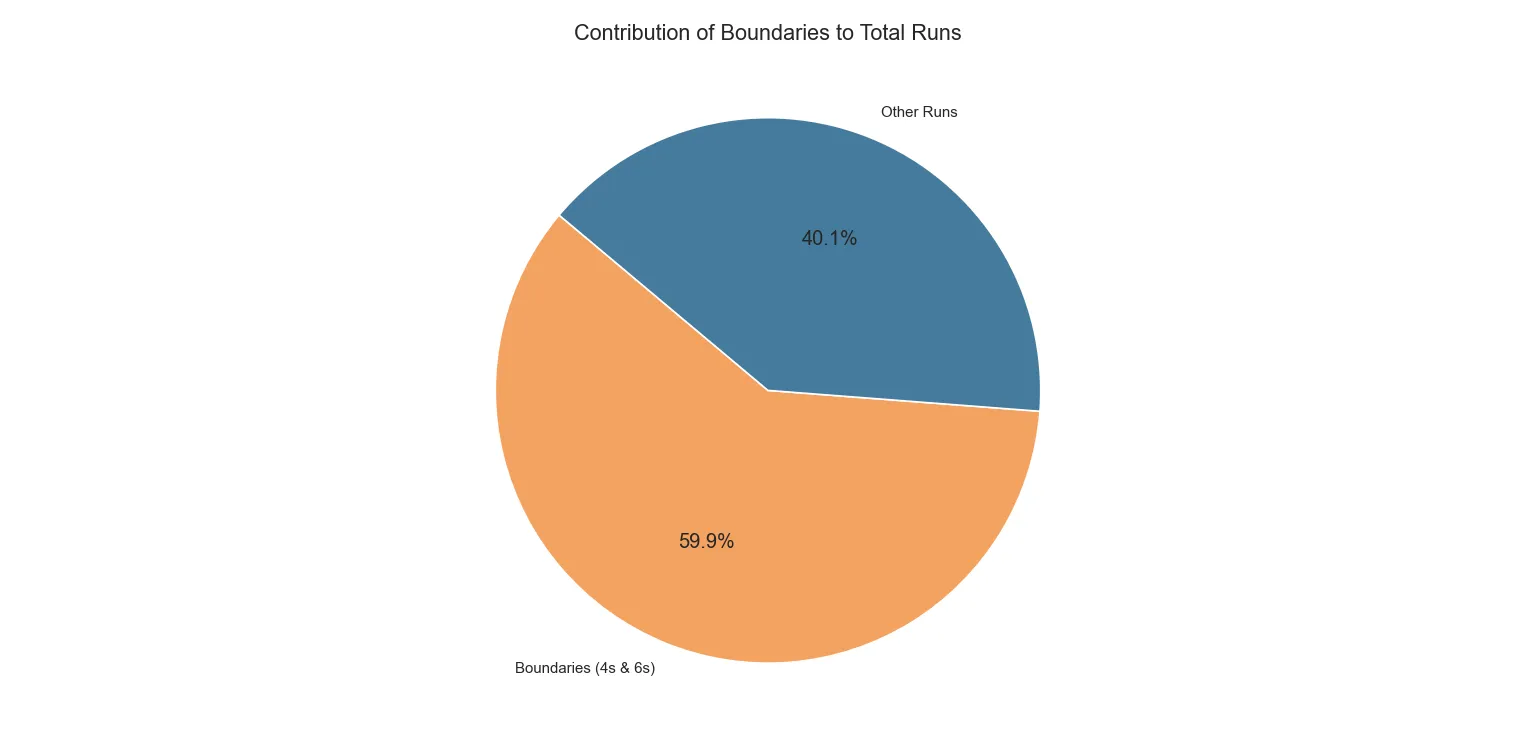
Boundary Contribution to Total Runs
59.9% of all runs come from boundaries — underscoring T20's boundary-or-bust nature.
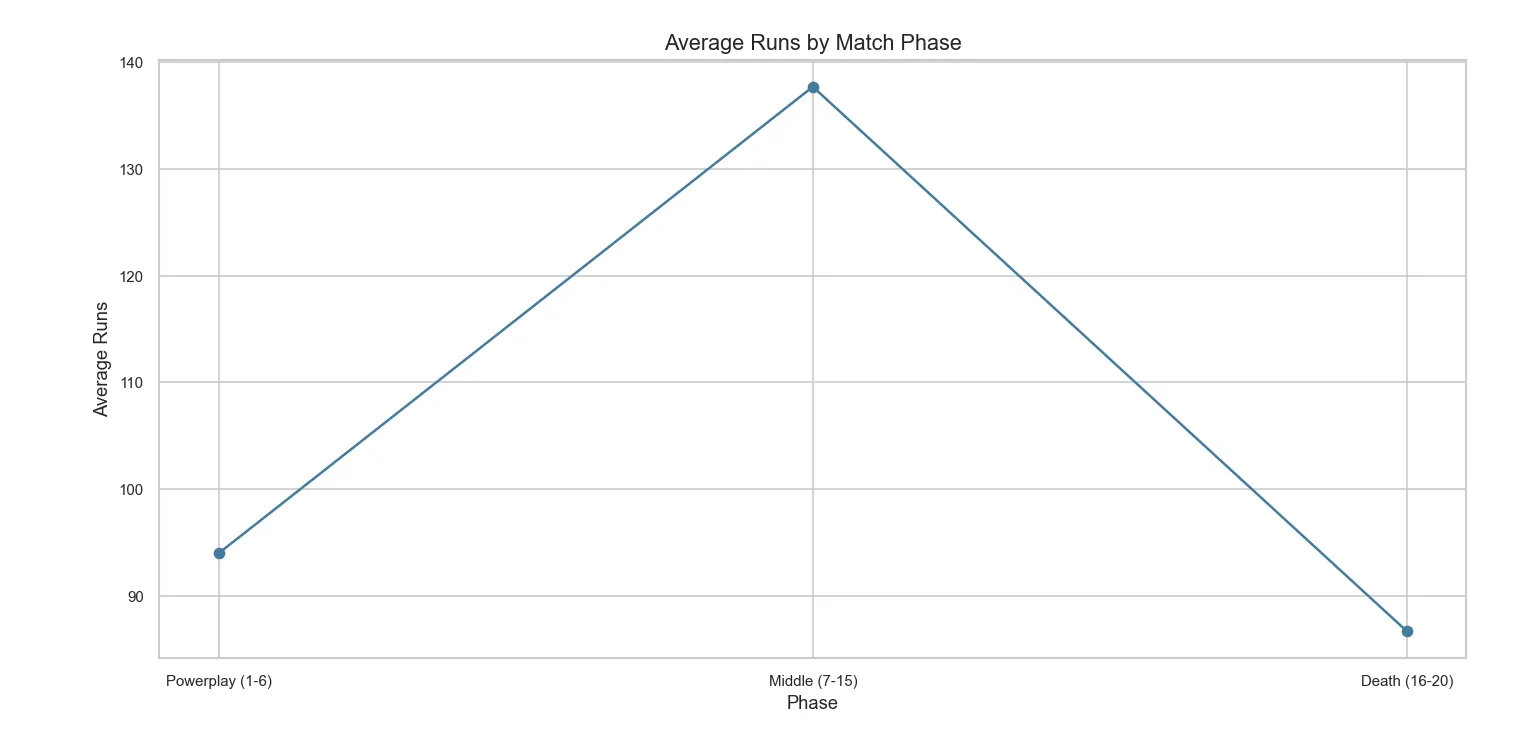
Average Runs by Match Phase
Middle overs peak at 137.8 avg runs per match phase — driven purely by volume of overs.